As KCUR examines how Kansas Citians divide themselves in our Beyond Our Borders series, we wanted to look at the demographics of the areas where we are focusing our reporting.
Earlier this year, we asked the community which lines were the most divisive in the Kansas City metropolitan area. Troost Avenue was cited as one of the most prominent racial and socioeconomic borders.
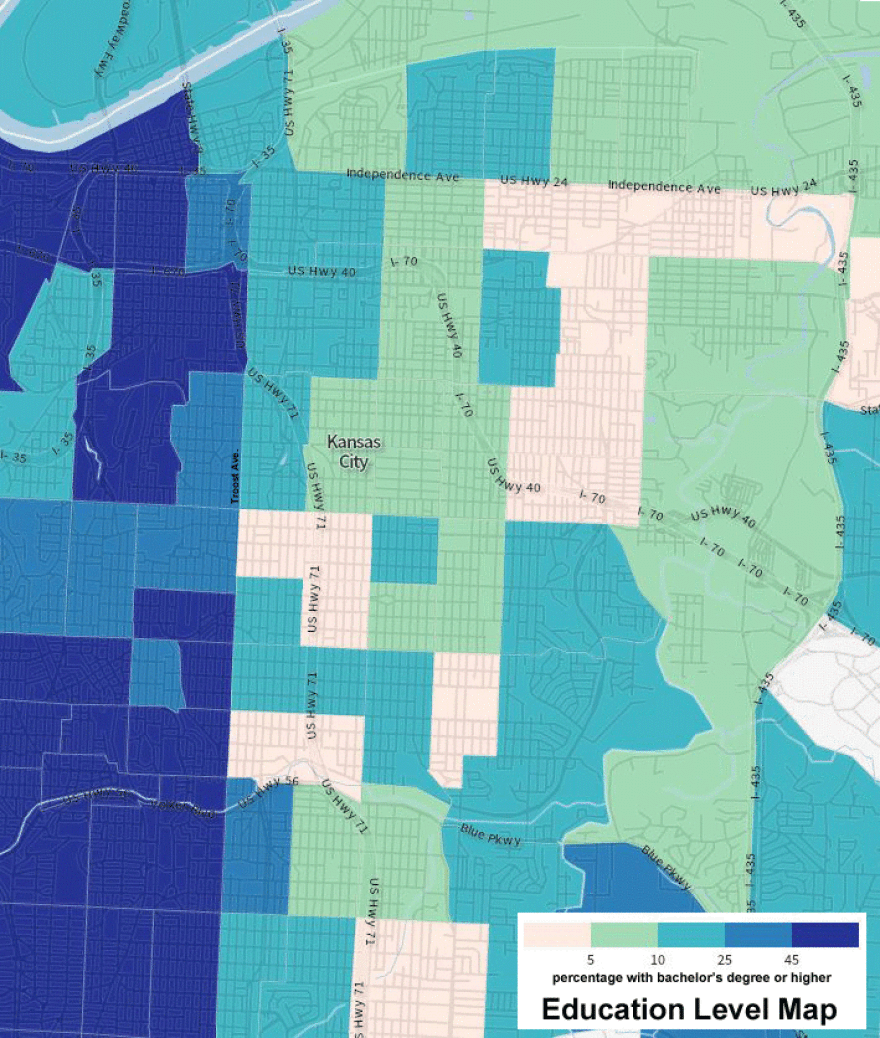
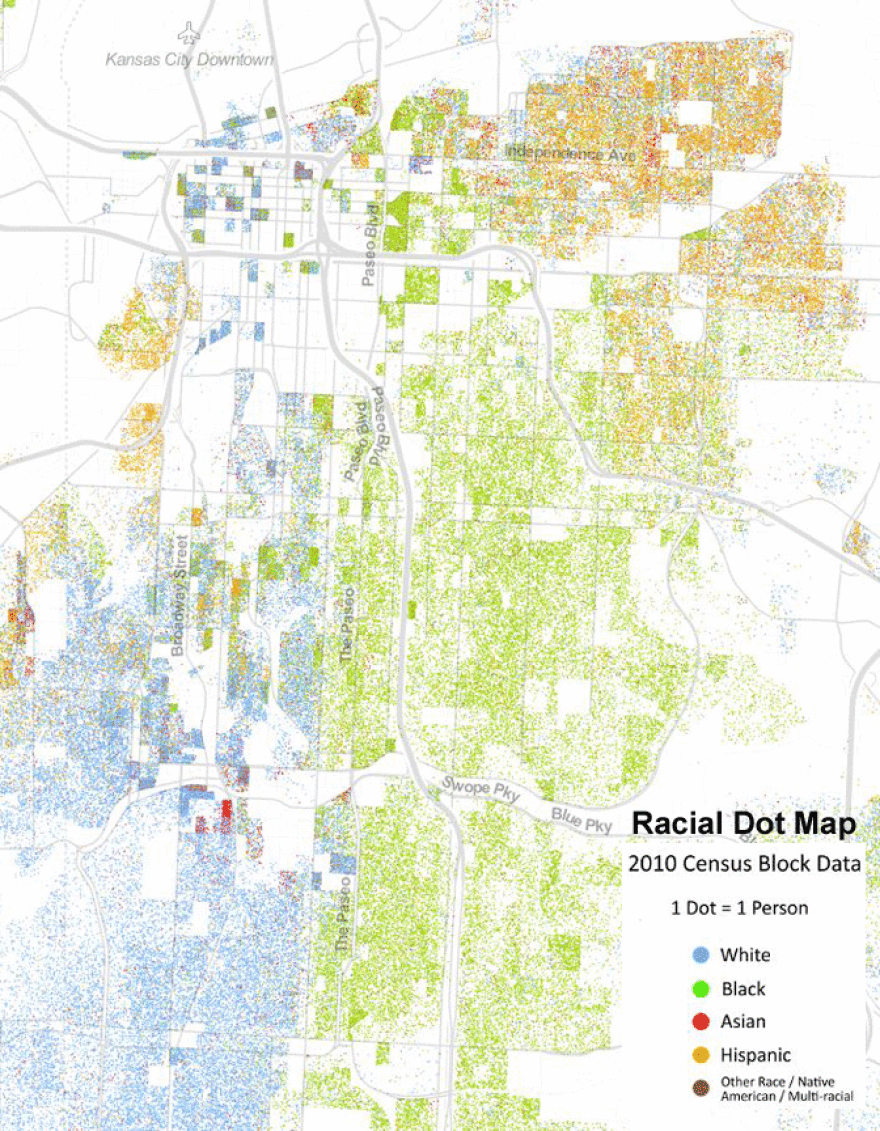
Here is a look at the racial diversity, median income and education level of the people who live west and east of Troost, making up the greater downtown and midtown populations in Kansas City, Mo.
The racial dot map below uses one dot to represent one person, showing a high concentration of whites to the west of Troost and a high concentration of blacks to the east.
It was created using data collected by the U.S. Census Bureau during the 2010 census by the Weldon Cooper Center for Public Service at the University of Virginia.
Troost is less of a dividing line when looking at median income data by census tract for the downtown and midtown region of Kansas City, Mo. But overall, the city's east side fares worse than the west. The map was created by WNYC, a public radio station in New York City, and also uses Census data from 2010.

Troost is clearly visible again in this next map that charts education level attainment. Using data from the 2012 U.S. Census Bureau's American Community Survey, officials mapped the percentage of the population in each census tract that holds a bachelor's degree or higher.

This look at Kansas City's Troost corridor is part of KCUR's months-long examination of how geographic borders affect our daily lives in Kansas City. KCUR will go Beyond Our Borders and spark a community conversation through social outreach and innovative journalism.
We will share the history of these lines, how the borders affect the current Kansas City experience and what's being done to bridge or dissolve them. Be a source for Beyond Our Borders: Share your perspective and experiences east of Troost with KCUR.


